Just who are we sacrificing Kent’s countryside for?

Failure to build affordable properties, a methodology based on out-of-date statistics and people moving into the county from London mean the housing onslaught on Kent does nothing to benefit our existing communities. It’s time our local authorities pushed back against the madness, says CPRE Kent planner Richard Thompson.
A question we at CPRE Kent are often asked is exactly what is causing the massive housing numbers the county is being asked to build. As this is a topic at the heart of much of what CPRE Kent cares about, it is worth exploring and understanding in detail.
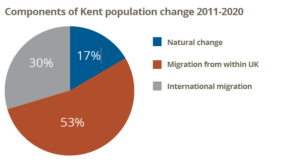
At the most basic level, it is predictions about future population growth based on past trends that set the baseline for how many houses need to be planned for. For Kent, it is an unavoidable fact that it is people moving to the county rather than natural growth (where there are more births than deaths) that has driven population growth over recent years.
Over the years 2011 to 2020, people moving to Kent accounted for 83 per cent of total population growth, against 17 per cent natural growth1. Of these people moving to Kent, the majority (64 per cent) have come from elsewhere in the UK, though mainly from London. Indeed, once movement between Kent and the rest of the country is taken into account, the internal migration net increase of 6,300 people to Kent in the year 2019-20 was effectively due to internal migration from London alone2.
In terms of how these past trends are then converted into how many houses are needed for each local authority area, it used to be the case that each local authority would individually interrogate the most up-to-date demographic data and trends to come up with its own housing figure.
This figure was expected to demonstrably meet the ‘housing need’ for an area though could be adjusted to account for local policy and supply factors. It was, however, deemed that this method just led to protracted arguments at Local Plan examinations, particularly around exactly what constituted the ‘housing need’ for an area and the extent to which ‘housing demand’ should be met (see ‘Housing by definition’ box).
To overcome this, the 2018 National Planning Policy Framework introduced the Standard Method for calculating local housing need. This is a centrally-set formula-based approach intended to simplify and speed up the process of determining housing numbers.
Although not mandatory, planning guidance states: “There is an expectation that the Standard Method will be used and that any other method will be used only in exceptional circumstances”. In practice, no Kent council has yet attempted to use any other method than the Standard Method.
It is, however, CPRE Kent’s view the Standard Method is fundamentally flawed. For starters, it is still the case that the Standard Method requires extremely out-of-date 2014-based household projection data to be used.
This is despite 2016- and 2018-based projections having been released, each of which progressively signals lower house numbers are needed. It is also the case that 2021 census data are now becoming available that completely reset and refine existing population assumptions.
There is simply no valid reason to continue to use the 2014-based data beyond the fact they artificially inflate housing numbers and so assist the current government’s desire to build 300,000 houses a year across the UK.
More fundamentally wrong, the Standard Method requires an adjustment to be made on the basis that the bigger the gap between average house prices and average wages in an area, the more houses need to be built in that area. The rationale is the deeply flawed thinking that simply increasing housing targets will bring down house prices.
Firstly, this expects the laws of supply and demand to operate while ignoring the simple fact that housebuilders will not build at a level that over-supplies a local housing market, forcing them to reduce prices and lower profits.
Secondly, this ignores the fact that it is the supply of money and ability to pay that drives housing price inflation. As set out above, with much of the demand for housing in Kent coming from the heated property market of London, it is absurd to think that requiring Kent authorities to grant more planning permissions is going to have any discernible impact on the county’s house prices.
Rather, and as we are beginning to see, what happens on the mortgage market is far more important in this regard. Both housebuilders Persimmon and Taylor Wimpey have recently confirmed this is why they are slowing build rates in 2023. In explaining it now intends to build fewer homes in 2023, Dean Finch, chief executive of Persimmon, stated: “If we build more than we can sell, we’ll quickly run down the cash balance”3.
Even more starkly, Jennie Daly, chief executive of Taylor Wimpey, said: “If we keep building at the pace we are in the hope that sales rates recover, we’d just end up creating lots of stock and come under pressure to reduce prices”4.
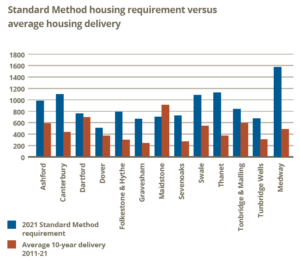
The consequence of the Standard Method is housing targets are being set that realistically will not be met by the market alone. Currently, across Kent the Standard Method would require some 11,947 houses a year to be built. This is almost double the 6,338 homes that on average get built each year in Kent. As set out in the table top right, for many of our districts it is well in excess of double the number they currently build.5
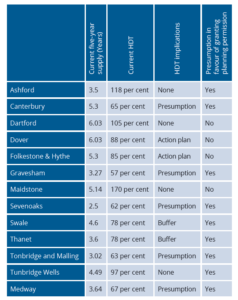
To make matters worse, under the current system, local authorities are effectively punished if the market does not build, or plan to build, enough houses in their areas. The punishment is either having to effectively grant planning permission automatically or set out plans around how they are going to allow more houses to be built.
As it stands, and set out in the below table, only Dartford and Maidstone are currently escaping such sanctions. This is despite at last count there being either planning permissions or Local Plan allocations for some 64,611 houses in Kent expected to come forward in the next five years, the equivalent of 10.2 years of housing supply if based on average delivery over the last 10 years.6
The combination of the above factors means developers are effectively able to cherry-pick the sites and build the houses that are going to be most profitable to them. This will disproportionately be large family houses on greenfield sites to serve the London market demand, further exacerbating the gulf between Kent house prices and Kent medium earnings.
What they are not building are the affordable homes needed for our existing communities, in particular homes for social rent. In 2020-21, only 1.87 per cent of houses built across Kent were for social rent, with not a single social rent property built in seven out of the 13 Kent local authority areas.7
Unsurprisingly, what is increasing is the number of second homes in Kent, having risen by 5.4 per cent over the last five years.8
This stuff matters. Firstly, there is no avenue to local authorities but to continue to accept and look to accommodate external market demand into their areas as dictated by past and recent trends. While such trends make a sensible starting point, there does need to be the ability for a sensible conversation as to whether our most constrained areas can continue to accommodate this demand indefinitely. At the very least, the conversation needs to be based on the most up-to-date data rather than those that are now almost 10 years old.
There is also the small matter of if the government is serious about addressing the problems associated with worsening affordability, policy efforts must concentrate explicitly on boosting supply of affordable tenures, not just overall supply in the hope developers will suddenly build affordable homes after all.
More fundamentally, the imposition of such unrealistic numbers based on arbitrary national targets only serves to alienate local communities and local politicians, who feel they have no control over what happens to their areas. No sensible conversation can then be had about how we deliver the homes that are needed against this backdrop. This is why CPRE nationally has been at the forefront of campaigning to replace the Standard Method’s arbitrary national formula approach with a more refined evidence-based approach to determining housing need.
As a result of this campaigning, and while there is still much to do, CPRE won some important concessions just before Christmas. Many of these were reflected in the revised version of the NPPF just consulted upon. There is also now far greater recognition of the flaws of the Standard Method and the unfair implications of the five-year supply and housing delivery tests.
Consequently, we are seeing encouraging signs that at least some Kent councils are pushing back. This includes Thanet and Swale, who have both decided to wait to see the implications of the revised NPPF before making any rash decisions for their communities about locking in the housing numbers dictated by the current system.
Unfortunately, this message is not getting across to all our councils. Canterbury City Council in particular seems absolutely wedded to blindly imposing the targets that will more than double current building levels. This is despite it having one of the strongest arguments to demonstrate that exceptional circumstances exist to take an alternative route.
With new councillors – and in some cases councils – across the county, there is perhaps no better time to remind them there is another way.

References
1 Stats taken from https://www.kent.gov.uk/about-the-council/information-and-data/facts-and-fi gures-about-Kent/population-and-census#tab-1,2 specifi cally
https://www.kent.gov.uk/__data/assets/pdf_fi le/0003/13827/Births-and-deaths- bulletin.pdf
https://www.kent.gov.uk/__data/assets/pdf_fi le/0004/8149/Whats-causing-Kents-population-growth.pdf
2 See Kent Analytics Migration Indicators in Kent 2020
3 https://www.thetimes.co.uk/article/persimmon-to-slash-its-housebuilding-rates-in-more-challenging-year-cdhqx2zpv
4 https://www.thetimes.co.uk/article/taylor-wimpey-will-build-fewer-houses-dzk95hs67
5 Houses built data taken from https://www.kent.gov.uk/__data/assets/pdf_fi le/0004/65740/KCC-Housing-information-audit-residential-land-supply.pdf
6 https://www.kent.gov.uk/__data/assets/pdf_fi le/0004/65740/KCC-Housing-information-audit-residential-land-supply.pdf
7 https://www.kent.gov.uk/__data/assets/pdf_fi le/0003/7356/Aff ordable-housing-in-Kent.pdf
8 https://www.kent.gov.uk/__data/assets/pdf_fi le/0005/81662/Housing-stock.pdf
- This article first appeared in the spring-summer 2023 edition of Kent Countryside Voice – the figures used in it were correct at the time of publication.